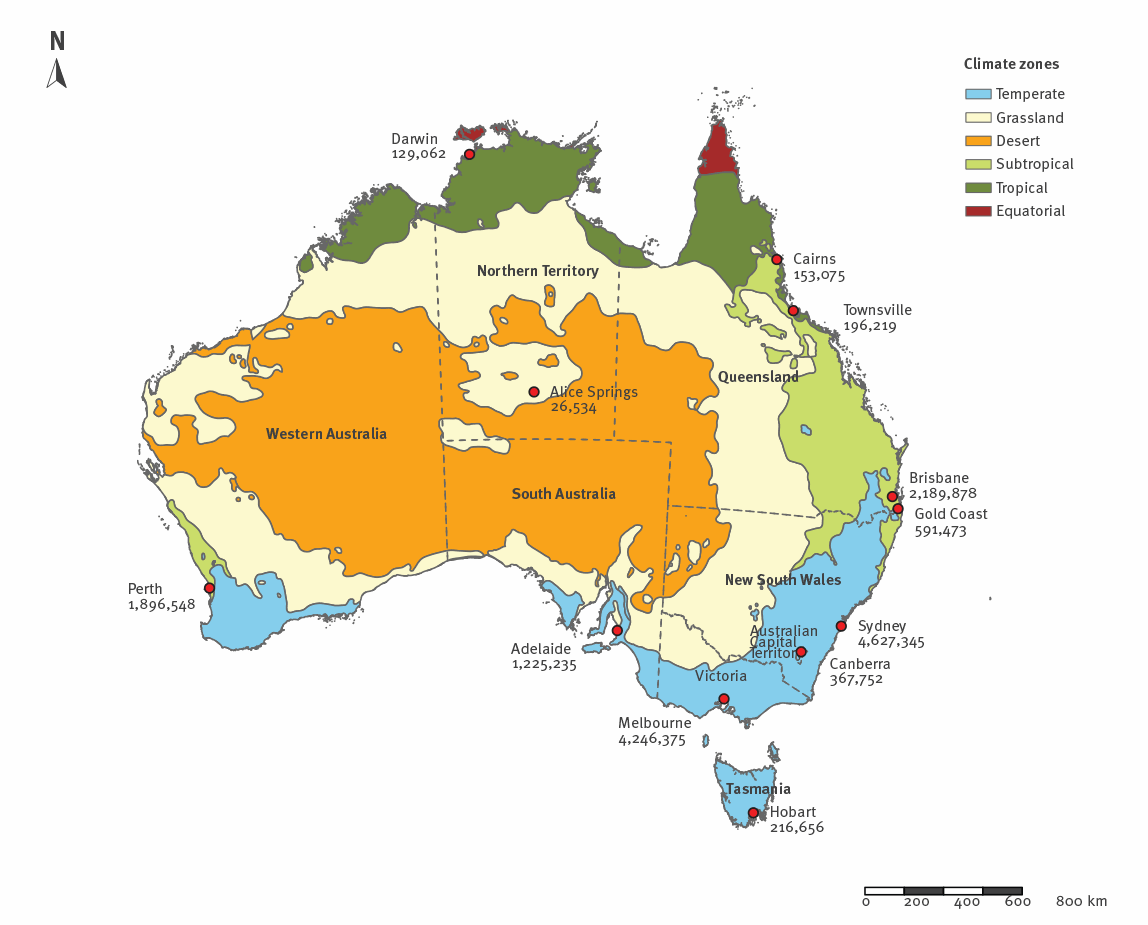
Figure 1
Climatic map of Australia, 2018
This article is copyright of the authors or their affiliated institutions, 2019.The plot shows the different climatic regions of Australia. The climatic regions of Australia are drawn according to the Köppen classification (Australian Bureau of Meteorology – obtained with permission – see: http://www.bom.gov.au/jsp/ncc/climate_averages/climate-classifications/index.jsp) with the populations of the main Australian cities in each state as of June 2018 (from the Australian Bureau of Statistics) added [32].
Citation:

